
LoRaWAN and cellular connected sensors already produce all the raw material needed for predictive analytics: temperature curves, battery voltage, reporting regularity, and door-open counts.
Most teams stop at a dashboard that shows the latest reading and a threshold alert. The signals that really predict what happens next — a slow drift, a widening gap between two correlated sensors, or an accelerating consumption trend — stay hidden in historical data nobody is watching.
Predictive maintenance is the most visible example of what sensor time series can achieve, but it is only one use of the same capability: predicting a future value from a past trend. The same models apply to several problems when a platform watches the trend, not just the threshold:
Predicting a failure and predicting an inventory level rely on the same technical foundation: modeling a trend instead of comparing it with a fixed line.
An anomaly-detection layer learns what “normal” looks like for each sensor — its daily cycle, seasonal pattern, and usual noise — then flags deviations from that learned baseline rather than from a static number. This distinction matters for field sensors: a warehouse temperature sensor behaves differently in July than in January, and a fixed threshold either misses summer drift or generates a false alarm every winter. A model trained on the sensor’s own history catches the deviation that matters — the one that does not match its own past — while ignoring the seasonal variation that does.
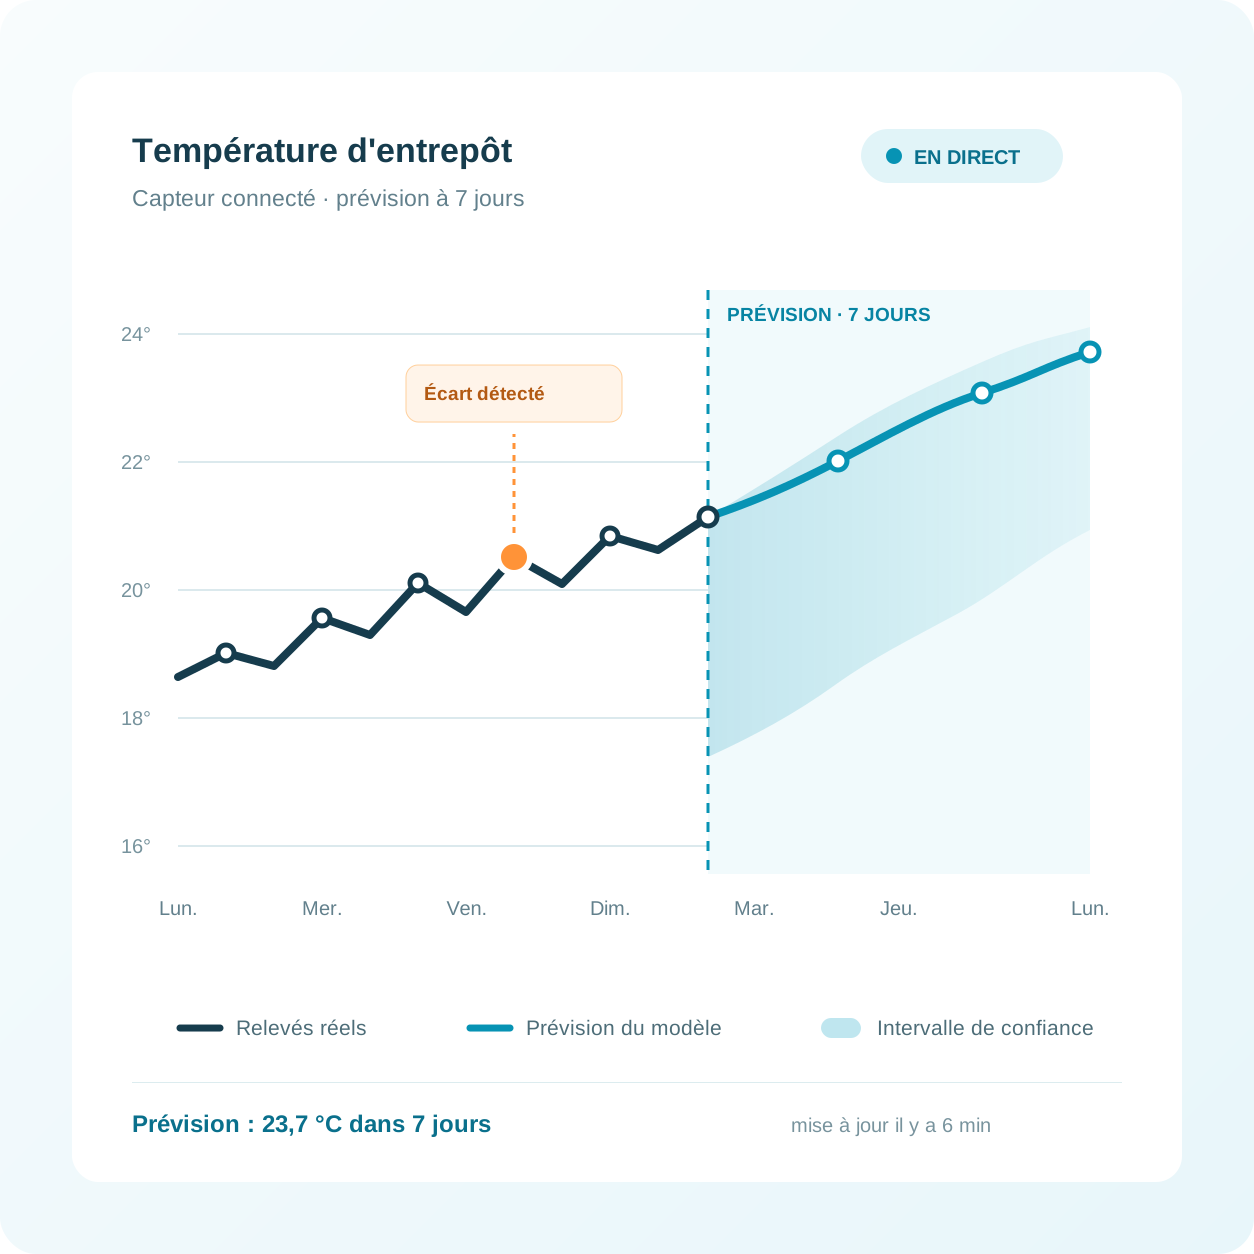
The quickest approach is to begin with sensors that already have enough history to train a model — any device that has been reporting for a few weeks or more — instead of trying to make every device predictive on day one. In Magic Sensor App, anomaly detection, trend forecasting, and maintenance prediction run directly on that history. Predictive analytics becomes less a separate project and more a layer on top of the monitoring a team already runs, whether the goal is anticipating a failure or forecasting a business value.
Pilot Things designs and builds sensor applications that combine LoRaWAN and LTE-M connectivity with the data layer needed to run predictive models on live sensor history. Teams already using Pilot Things to manage connected devices can add predictive intelligence to that same data without standing up a separate analytics pipeline — and teams evaluating a new sensor deployment can build forecasting and anomaly detection in from the start.
Predictive analytics
Let’s discuss your sensor data and the predictive use cases that could be most valuable to your business.
Contact us